Same work, two models
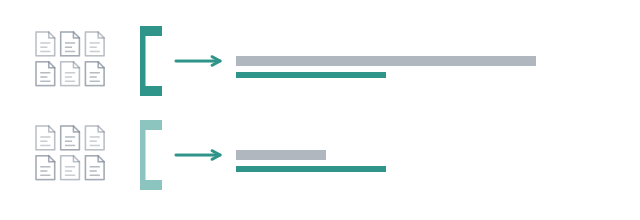
“Which model should the coder run on” gets asked a lot, and most answers are benchmarks nobody ran on their own code. The honest version is small: the same work, on the same repository, on two models, with the bills side by side. This page does that twice, once from the prompt line in a minute and once properly.
The knob
Comparing models requires the model to be an argument. It is one of four places a subagent’s model can come from, and the nearest wins:
--modelon/runor/step, ormodelon thesubagenttool. Every subagent of that call, whatever its file says.model:at the top of a flow file.model:in the agent’s frontmatter.pi’s own settings.
No environment variable is read anywhere: an ambient variable is exactly how a
run ends up on a model nobody named. Measured, in this repository: a /run explore with no --model put all four subagents on a model named nowhere in
the tree, and nobody noticed until usage.json said so. An experiment that
left every level empty is measuring the operator, not the models.
None of the shipped agents or flows declares a model:, on purpose: a package
that pinned one would override your settings and fail outright for anyone
without a key for that provider. A definition that ships leaves it open; a
measurement pins it.
The quick version
The two compared below are open-weight models served from the same endpoint:
provider/model-a, of 31B parameters, and provider/model-b, a 120B
mixture-of-experts model. Put two your pi can reach in their place: what this
page shows is the shape of the comparison, and the shape does not depend on
which two.
The same question, once per model:
/run --model <provider/model-a> explore how is the wall time of a subagent measured, and where is it shown
/run --model <provider/model-b> explore how is the wall time of a subagent measured, and where is it shown
Two folders under runs/, two usage.json, one table:
provider/model-a |
provider/model-b |
|
|---|---|---|
wall |
112.0s |
44.1s |
busy |
191.6s |
100.7s |
parallelism |
1.71 |
2.28 |
input |
283.6k |
937.9k |
output |
8.2k |
8.2k |
tool calls, three scouts |
6 / 5 / 13 |
18 / 30 / 17 |
cost |
not reported |
not reported |
The larger model was two and a half times as fast and spent more than three
times the input tokens: its scouts made three times the calls, each resending
a growing context. Both answers found performance.now() in
src/subagent.ts, where the code has it at lines 217, 283 and 387. The first
said its three scouts disagreed on the line numbers, then settled the
disagreement on the wrong side: it named 157, 187 and 282 as correct. The
second gave the lines within a few of the truth and a table of eleven places
the wall time is shown, among them a “VS Code extension UI” and CSV reports,
neither of which exists here. Read the two synthesiser reports in the two
folders and you know more about these models on your code than a leaderboard
can tell you.
One run each, though. The fast model may have been lucky, the slow one may have hit a slow minute on a shared server. That is the limit of the quick version, and it is why the proper one repeats.
The proper version
experiment is a harness above a workflow: M models, N repetitions, one
directory per cell, one table. It returns no Result and composes with
nothing, deliberately, because a harness that could be nested inside a
workflow would be measuring itself.
node examples/12-experiment.ts <provider/model-a> <provider/model-b>
The example runs a coder and reviewer loop twice per model on this repository, with the coder’s tools cut down to read-only so that it describes the change rather than making it, and prints the table:
| model | runs | ok | converged | iterations | usage | mean wall | mean $ |
| --- | --- | --- | --- | --- | --- | --- | --- |
| provider/model-a | 2 | 2/2 | 2/2 | 1×2 | 4 turns 368.6s ↑30k ↓21k | 184.3s | not reported |
| provider/model-b | 2 | 2/2 | 2/2 | 1×2 | 4 turns 47.9s ↑53k ↓5.8k | 24.0s | not reported |
The fast model of the quick version was fast again, seven times over this
time, and both converged in one iteration both times: 1×2 is two runs of one
iteration each. ok and converged are two columns because they can differ,
a loop that reaches its cap with no LGTM being ok and not converged; here
they did not. The usage has no cost in it and mean $ says not reported,
since the provider reports none, and a table cannot leave a cell empty the way
a line leaves a figure out. Whether either review was worth its price is in
the transcripts under runs/, and is the question you actually had.
Something else is in those transcripts. The larger model’s first cell called
a tool with an empty name twice, read with no path once, and grep with a
pattern that does not parse twice. Each came back an error, Tool not found, Validation failed for tool "read", rg: regex parse error, and the
turn went on. That is the
boundary from page five seen from the
other side: what a session holds is what can run, whatever the model reaches
for.
Its shape is short enough to copy:
import { experiment, experimentTable, loop, saysWord } from "@ai-for-dev/combo";

const report = await experiment({
	models: ["provider/model-a", "provider/model-b"],
	repetitions: 2,
	timeoutMs: 300_000,
	run: async (cell) => {
		const result = await loop({
			...cell.options,
			steps: [coder, reviewer],
			input: task,
			lifetime: "workflow",
			until: (step) => saysWord(step.output, "LGTM"),
			maxIterations: 3,
		});
		return { ok: result.ok, converged: result.converged, iterations: result.iterations };
	},
});

console.log(experimentTable(report).join("\n"));
Spreading cell.options is the contract. It carries the cell’s model and
its export directory, the experiment’s signal, deadline and cwd, and a
listener that records every event. A callback that rebuilds those by hand puts
its subagents on the wrong model in the wrong directory, and measures nothing.
Whatever the callback returns becomes the table’s columns, so converged and
iterations are there because this callback said so and for no other reason.
The rules it keeps, each one a way a comparison learns to lie:
Sequential by default. Two cells racing for one machine measure the contention. Raise
concurrencywhen the providers are remote and you know what you are trading.Model-major order. Every repetition of the first model, then the second, so an interrupted matrix holds finished models rather than a fragment of each.
A failed cell stays in the report, with its usage. Dropping it would turn “two models out of three answered” into a clean comparison of the survivors. A callback that throws is a failed cell, not a crashed experiment.
Sums are stored, means are displayed.
experiment.jsoncarries totals; the mean column is computed when the table is drawn and never written down. Averaging averages is how a study starts lying about itself.Every cell keeps its event stream,
events.jsonl, with no way to turn that off: a cell whose stream was not kept can only be re-run, and a matrix is expensive.
runs/2026-09-24_00-45-16/
├── experiment.json
├── experiment.md
├── provider-model-a/
│   ├── rep-1/    usage.json  events.jsonl  coder-1.jsonl  reviewer-1.jsonl …
│   └── rep-2/
└── provider-model-b/
    └── …
A flow needs no special support: runFlow(run, input, { ...cell.options, runDir: cell.dir }) in the callback runs explore per cell, each cell its
own run directory, and the quick version above becomes the proper one in a
few lines.
Every subagent in these eleven pages was placed by you, through a call, a file or a flag. The last page is about the one that places its own.