Three scouts, one answer
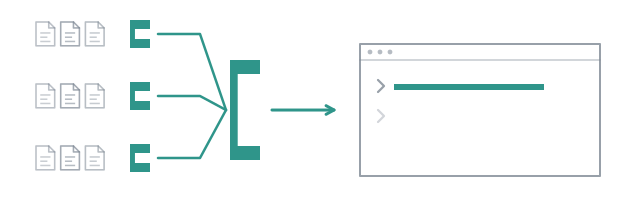
A question that spans a repository has three parts hiding in it: where the thing is implemented, how it is tested, and what the documentation claims. One agent answering all three reads everything, and a small one gets the first part right and drifts on the other two. Three agents answering one part each read a third as much, at the same time, and somebody still has to put the parts together without inventing the joints.
That shape comes up often enough to ship as a file. Look at it before you run it:
cat flows/explore.md
---
name: explore
description: Three scouts read the code in parallel, then one agent answers from what they found
input: string

nodes:
  - id: look
    map:
      - Find where the thing asked about is implemented, and name the files.
      - Find how it is tested, and what the tests actually assert.
      - Find what documents it, and whether that matches the code.
    concurrency: 3
    do:
      - id: find
        agent: scout
        retry: 1
        reads: [input, item]
        on-fail: continue

  - id: answer
    agent: synthesiser
    retry: 1
    reads: [input, look]
---

## find
Do the task under `item` about the question under `input`. Report what you
found with file paths and line numbers, and say plainly when you found nothing:
an empty report is worth more than a guess.

## answer
Answer the question under `input` from the three reports under `look`. Where
they are all silent, say so.
Two nodes. A map over three literal tasks, whose one node is a scout’s
turn, then a synthesiser that reads the question and the three reports. Each
turn is handed exactly what its reads: names, each under its own heading.
Nothing in the file decides anything at run time: our code walks it, and the
only thing a model chooses is what to write. Both agent nodes carry
retry: 1: a turn that fails on the provider, off its deadline or off its
schema is asked once more, so each node is asked at most twice. A stop is
never retried. Flows has
the rules.
Run it
/run explore how is the wall time of a subagent measured, and where
The flow’s plan appears above the prompt at once, and fills as it goes:
● explore · 1 visit · 20s · ↑20k ↓714
● look · 1/3
  ✓ look[1] · 13s · ↑20k ↓714
  ● look[2]
    ● look[2]/find
      ● scout#2  read test/trail.test.ts  provider/model · 19.1s
  ● look[3]
    ● look[3]/find
      ● scout#3  read docs/tutorials/03-keep-the-session-out.md  provider/model · 19.1s
○ answer · agent synthesiser (.pi/agents/synthesiser.md) · reads input, look · retry 1 · timeout 30m by default · ≤ 2…
esc stops everything · ctrl+↑↓ selects · ctrl+del stops the selected one
look[1] has finished and folded to one line, with its tokens. The two scouts
still working show a clock and no tokens: pi reports a turn’s tokens when the
turn ends, and until then there is no figure to show. The first line counts
the run’s time as it goes and adds up what has ended. The dimmed last node
says what the file gave it: what it reads, its one retry, and a bound of two
turns, which the terminal’s width cuts to ≤ 2…. Watch scout#2: it greps
twice, reads src/subagent.ts, then test/trail.test.ts,
test/measured.test.ts and test/export.test.ts. That is the branch that was
asked about tests, and you can see it doing that and nothing else. When the
last scout closes, the synthesiser runs alone for 28 seconds, and the answer
lands in the conversation:
◆ explore
Result of the explore flow, asked to: how is the wall time of a subagent measured, and where.

The wall time of a subagent is measured in src/subagent.ts by calculating the elapsed time from the moment the subagent
is spawned until the current time or until it is closed, using performance.now() to ensure a monotonic clock.

Specifically:
- At spawn: The start time is recorded: const spawnedAt = performance.now(); (line 174).
- On demand: The usage getter calculates the current elapsed wall time: wallMs: performance.now() - spawnedAt (lines
  206-208).
- At close: The final total wall time is captured in the close() method: const finalUsage = { ...usage, wallMs:
  performance.now() - spawnedAt }; (line 316).

This implementation is documented in docs/guide/measurements.md as wallMs ("spawn to close, waiting included"). It is
tested indirectly through test/trail.test.ts, test/measured.test.ts, and test/export.test.ts, which assert that wall
time reflects actual elapsed time rather than the sum of busy times.

The reports disagree on the line numbers for the spawn time and the usage getter; the code supports the line numbers
provided in the third report (174 and 204-207 respectively).

ok · runs/2026-09-24_03-56-30

✓ explore · 5 visits · 1m20s · ↑142k ↓5.8k
✓ look · 3 items · 52s · ↑133k ↓4.1k
✓ answer · synthesiser · 28s · ↑9.8k ↓1.7k
That is the frame, verbatim. The line under the answer says how the run ended and where it is on disk, and the last three lines are the plan as it finished, drawn for you and not sent to the model.
Read the disagreement
The three scouts each read src/subagent.ts and gave line numbers for the
same three statements: 201, 177 and 174 for the spawn, 233-236, 216-219 and
204-207 for the getter, and 316 from all three for the close. The
synthesiser’s definition tells it to name a disagreement and say which report
the code supports, reading the files to settle it. It read
src/subagent.ts once, ruled for the third report, and listed the getter as
206-208 a few lines above its ruling. Settle it yourself:
grep -n spawnedAt src/subagent.ts
217:	const spawnedAt = performance.now();
283:			return { ...usage, wallMs: performance.now() - spawnedAt };
387:			const finalUsage = { ...usage, wallMs: performance.now() - spawnedAt };
None of the nine numbers was right, and the synthesiser’s ruling was wrong too, after it had read the file. The content was right three times over: the mechanism, the clock, the three places. The line numbers were a small model’s guess written as a citation.
The one number all three agreed on is the worst of them. Each scout’s first
grep matched line 34 of the next page, which
quotes an earlier scout’s src/subagent.ts:316 and then says that none of
that report’s numbers is right. All three wrote 316, and the
synthesiser, seeing no disagreement there, said nothing about it. Three
reports that agree are one claim, not three, when they read the same page.
Three that disagree at least tell you where to look; an answer that averaged
them, or took the first, would have hidden it.
The synthesiser works by one rule, and so should anything that folds several
agents’ work into one: a report is a claim, not evidence. A branch that fails
comes through the same way: on-fail: continue turns a failed scout into a
failed report in its slot, so the answer can say “not covered” instead of
answering from two reports as if there had been three.
What it cost, and where that is written
Open the folder the answer named. It is the run directory:
find runs/2026-09-24_03-56-30 -type f -not -path '*/.sessions/*' | sort
runs/2026-09-24_03-56-30/answer/synthesiser.html
runs/2026-09-24_03-56-30/answer/synthesiser.jsonl
runs/2026-09-24_03-56-30/journal.jsonl
runs/2026-09-24_03-56-30/look[1]/find/scout.html
runs/2026-09-24_03-56-30/look[1]/find/scout.jsonl
runs/2026-09-24_03-56-30/look[2]/find/scout.html
runs/2026-09-24_03-56-30/look[2]/find/scout.jsonl
runs/2026-09-24_03-56-30/look[3]/find/scout.html
runs/2026-09-24_03-56-30/look[3]/find/scout.jsonl
runs/2026-09-24_03-56-30/main.jsonl
runs/2026-09-24_03-56-30/snapshot.json
runs/2026-09-24_03-56-30/usage.json
One transcript per turn, under the visit that ran it and rendered by pi
itself. snapshot.json is the flow as it was checked, journal.jsonl every
visit as it ended, which is what a resume reads; main.jsonl is your own
session. .sessions/, left out above, is where pi kept the sessions those
transcripts were exported from. And usage.json:
subagent |
wall |
input |
output |
what it did |
|---|---|---|---|---|
scout#1 |
12.6s |
19.9k |
714 |
three tool calls, the implementation |
scout#2 |
51.6s |
68.2k |
1.9k |
six tool calls, the tests |
scout#3 |
27.4s |
44.6k |
1.5k |
four tool calls, the docs |
synthesiser#1 |
27.7s |
9.8k |
1.7k |
one tool call, the answer |
run |
79.3s |
142.5k |
5.8k |
parallelism 1.50 |
parallelism is busy time over wall time: 119 seconds of work happened in
79. Three scouts did not give three times the speed, because the slowest
branch sets the pace and the synthesiser waits for all of them. Here the
tests scout alone took 52 of the 79 seconds; the other two had long finished,
and the answer could not start until it did. No retry ran: every turn ended
the first time. That number is in usage.json because it answers “was the
fan-out worth it”, and nothing on screen could have told you.
The docs branch is worth a look. scout#3 was asked what documents the wall
time. It read src/subagent.ts, then the page its grep had matched, then
docs/guide/measurements.md, and concluded that “the documentation matches
the code implementation”. The page it read gives the file’s own numbers,
217, 283 and 387, and scout#3 reported 316 all the same. A document that quotes a model is one more claim, and a scout
reading it cannot tell.
cost reads 0 in every row. That provider reports no cost, and combo does
not estimate one from characters: a zero here means “not reported”, never
“free”, and the screen leaves it out rather than print a price of nothing.
Measurements says what is counted and what is
refused.
The answer is in your context now
Look at the status line: 0.0% before, 0.2% after. The answer arrived as a
message the model can read, prefixed with what produced it, so the next thing
you type can lean on it:
> and is busyMs measured the same way?
No,
busyMsis measured differently. WhilewallMstracks the total elapsed time from spawn to close (including idle time),busyMstracks only the time the subagent was actively working. …
That is /run’s reason to put the answer there: an exploration you have to
paste back into the conversation yourself is a report in the wrong place.
It is also what it costs. Before answering, the session took the report’s
word for where to look and read src/subagent.ts itself, and the status line
went from 0.2% to 14.0%: pi’s own system prompt and the context files,
paid on the session’s first request, and one of the files the scouts read so
that you would not have to. It had the file in front of it and still quoted
the report’s line 174 for the spawn, then gave 224, 257 and 265 for three
lines the file has at 294, 331 and 341. A main model that has read a report
starts acting on it. It becomes the orchestrator, and every step you ask for
next is chosen against a conclusion it already holds. When the window is
meant to stay a console, what reaches it changes the answers.
Next: Keep the session out of it.